
The field of statistics, the science of learning from data and measuring, controlling, and communicating uncertainty (Wild et al., 2018), has existed in different forms for over 200 years, evolving into a well-respected and essential academic discipline (Shmueli et al., 2020)—however, Fienberg. (1992) claimed that statistics in any sense like ours point to the works of John Graunt as an appropriate starting line. This claim is coherent with (Wild et al., 2018) suggestion that the statistical analysis of data is usually traced back to the work of John Graunt (e.g., his 1662 book Natural and Political Observations) and Wild et al., 2018 supported their claim by exemplifying Graunt’s conclusion that the plague was caused by person-to-person infection rather than the competing theory of “infectious air” based on the pattern of diseases through time.
Nevertheless, since the data universe is expanding and changing so fast, statisticians, educators, business practitioners, and the new generation should focus more on looking forward than looking back; looking back is beneficial but predominantly to pillage human history’s stockrooms of wisdom (Wild et al., 2018) to shape our future better. (Shmueli et al. (2020) suggested that statistics prominence expanded rapidly in the 1900s with the explosion of new and enormous data sources. This wave of activity was initiated by the concerns of William Gosset, reaching its culmination in the insights of Ronald Fisher with the development of experimental design, analysis of variance, maximum likelihood estimation, and refinement of significance testing, followed by the collaboration of Egon Pearson and Jerzy Neyman in the 1930s, who give rise to hypothesis testing and confidence intervals (Wild et al., 2018). At about the same time came Bruno de Finetti’s seminal work on subjective Bayesian inference and Harold Jeffreys’s work on “objective” Bayesian inference so that by 1940, we had most of the basics of the theories of the “modern statistics” of the twentieth century (Wild et al., 2018). This brings us to our time, where statistics have focused on biological applications like genetics data generated from human genome sequencing for most of this century. However, according to Shmueli et al. (2020), in the last decade, we have experienced an astounding increase in data availability in business fields with a correspondent interest in its application in business. This demand has its roots in practical solutions that business analytics have produced in industries (Shmueli et al., 2020).
Business Analytics
Business analytics is the “practice and art” (Shmueli et al., 2020 p3) of manipulating quantitative data increasingly central to decision-making in modern organizations (Power et al., 2018). Still, mining the term could suggest different things to different organizations, including more than just counting, rule checking, and basic arithmetic; it encompasses a comprehensive range of data analysis methods (Shmueli et al., 2020). Analytics, contrary to analysis (the process of separating a whole problem into its parts so that the details can be critically examined at the granular level), is a multifaceted and multidisciplined approach to understanding and addressing complex situations by taking advantage of mathematical models and data to understand the complex world that we are living in (Delen & Ram., 2018). Power et al. (2018) claimed that the increasing ease of gathering, storing, and processing data has led to a highly varied and growing data set for analysis; therefore, many employers want to hire people who can apply tools to make sense of the analysis’s input and output.
According to (Delen & Ram., 2018), analytics has become the current slogan in business circles; it has become a new label for evidence-based management: the need, availability, affordability, and culture change. Amid the current unforgiving market conditions, analytics promises to provide managers with the insight they need to make better and faster decisions, improving their competitive posture in the marketplace by acting as the rescuer and protector of business managers from the complexities of global business practices (Delen & Ram., 2018). advances in hardware and software are also reflected in pricing, continuously reducing the cost of ownership for computerized analytic systems. Delen & Ram. (2018) explained that in addition to ownership models, software-as-a-service and hardware-as-a-service business models and cloud-based enablers allow businesses with limited financial resources to rent analytics capabilities and pay for only what they use them. There is a shift from old-fashioned intuition-driven decision-making to the new age of fact/evidence-based decision-making at the organizational level. Baby Boomers have diverse characteristics. While some Baby Boomers have been exposed to information technologies, others need more training with computerized systems. In addition, age-related changes, such as physical or cognitive issues, could affect some Baby Boomers and their interactions with information technology (Bennett-Kapusniak., 2015). On the other hand, Generation X individuals, mainly driven by Utilitarian purposes and information searches (Calvo-Porral & Pesqueira-Sanchez., 2020), are inclined to adopt new technologies to satisfy their core professional and personal needs. This study found a link between generations’ changes in the workforce and the shift from intuitive, evidence-based decision-making. In this regard, (2002) suggested that the timing of evidence-based practice is not accidental; it has developed within a specific context, particularly the current preoccupations with risk, ambivalence about science and professional expertise, and the concern with effectiveness. This transparent process excludes uncertainty, promising security for practitioners in an age of anxiety, researchers, managers, and consumers. In this context, Delen & Ram. (2018) suggested that this evidence-based managerial paradigm shift will only intensify as the new generation of quantitatively savvy managers replaces the baby boomers.
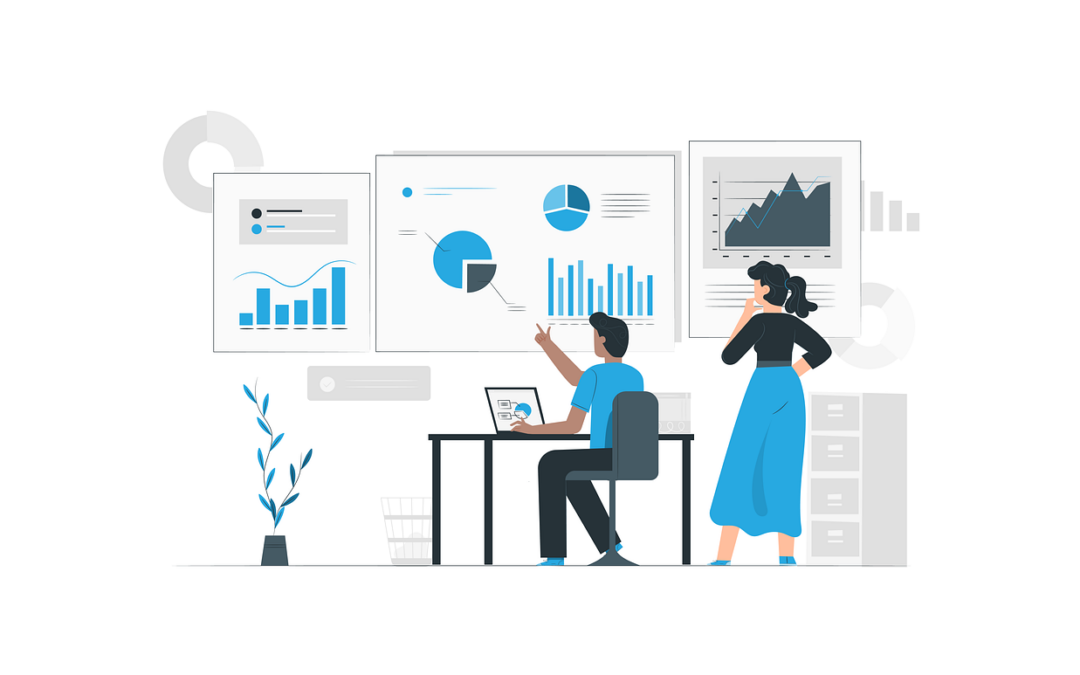
The next level of business analytics, now called business intelligence, refers to data visualization using charts, tables, and interactive dashboards, allowing the user to access real-time data. The need to display massive amounts of data in a way that is easily accessible and understandable climaxed with the design, development, and application of computer-generated graphical representation of the data that provides adequate data representation originating from different sources. Therefore, this enables decision-makers to see analytics visually, making it easy to make sense of the data and helping them discover patterns and comprehend information (Sadiku et al., 2016).
Business Analytics Major Perspectives
As a process of transforming data into actions through analysis and insights into organizational decision-making and problem-solving, business analytics is often viewed from three primary perspectives: descriptive, predictive, and prescriptive (Evans & Lindner., 2012).
Descriptive analytics summarize data into meaningful charts and reports, allowing managers to obtain standard and customized reports, drill down into the data, and make queries to understand the impact of a business move, like finding problems or areas of opportunity or identifying patterns and trends in data. The descriptive dashboard may be used as a monitoring tool to assess the value of other business operations but does not drive decisions directly (Berman & Israeli., 2022). On the other hand, predictive analytics analyzes past performance to predict the future by examining historical data, detecting patterns or relationships in these data, and then extrapolating these relationships forward in time, according to Evans and Lindner. (2012). It generally predicts occurrences or probabilities based on the analysis of historical data using data-mining techniques to make recommendations based on these predictions (Mishra & Silakari (2012). The third perspective is prescriptive analytics, the most sophisticated type of business analytics since it brings the most significant intelligence and value to businesses (Lepenioti et al., 2019); prescriptive analytics uses optimization to identify the best alternatives to minimize or maximize some objectives by suggesting or prescribing the best options to take advantage of the predicted future under two levels of human intervention: decision support, e.g., providing recommendations; decision automation, e.g., implementing the prescribed action. Evans and Lindner. (2012) suggested that prescriptive analytics has many applications in business areas, including operations, marketing, and finance.
Applications of Business Analytics
Delen and Ram (2018) explained that even though the business analytics wave is in some ways new, there are numerous applications of analytics covering almost every aspect of business practices. According to Delen and Ram (2018), there are many success stories in customer relationship management where sophisticated models are developed to identify new customers, up-sell/cross-sell opportunities, and customers with a high propensity to attrite. Businesses use social media analytics and sentiment analysis to stay on top of people’s opinions about their products, services, and brands. Organizations in every other industry, size, shape, and location are using analytics or exploring the use of analytics in their operations to gain/retain a competitive advantage (Sharda et al., 2013). According to (Sharda et al., 2013) study, these include organizations in the private sector, government, education, military, etc. Finding a business issue where several analytics applications cannot be found would take much work. From business reporting to data warehousing, data mining to optimization, analytics techniques are used widely in almost every facet of the business (Delen & Ram., 2018).
Data Mining
Data mining is a business analytic method that extends beyond counts and descriptive techniques reporting practices based on business rules (Shmueli et al., 2020 p5); it includes statistical and machine-learning techniques to inform managers and decision-makers, often in automatic fashions. Shmueli et al. (2020) claimed that prediction is essential to data mining. Reacting to a past event and waiting for it to happen again to correct it is like reading old news to learn what is happening now in your neighborhood. Companies should predict what the future will bring them to stay competitive. Though data mining could mean, for many, digging into a vast store of data collected from past events (Shmueli et al., 2020 p5), it is the capability of standing at the confluence of statistics and machine learning that makes data mining a unique tool for predictive analytic and predictive modeling. However, it may confuse people if, instead of seeing data mining as a new method born due to the convergence of statistics and machine learning, they compare them as separate entities; this could lead to seeing data mining as a tool used for studying and graphing past data in search of general patterns.
Big Data
Big data is a term for massive data sets with a large, more varied, complex structure with difficulties storing, analyzing, and visualizing other processes or results. Big data analytics researches massive amounts of data to reveal hidden patterns and secret correlations (Sagiroglu & Sinanc., 2013). According to Shmueli et al. (2020), data mining and big data go hand in hand. Big Data is a relative term used to refer to today’s data compared to the data that existed in the past, characterizing its differences in terms of volume, velocity, variety, and veracity. The term volume is allegoric to the amount of data, and velocity refers to the flow rate or speed at which data is generated and changed, meaning that companies need to develop continuous processes to analyze data (Davenport et al., 2012). Variety denotes the different types of data being generated. Veracity signifies the organic distributed process at which data is generated, not subjected to the controls and quality checks that apply to data collected for studies.
Conclusion
Business Intelligence is about providing the correct data at the right time to the right people to make the right decisions – Nic Smith with Microsoft BI Solutions Marketing. This program forms individuals with skills that do not produce a significant outcome when they are isolated in the minds of different people. However, when combined and hosted in one brain, they become critical, valuable, and indispensable for businesses and organizations. Therefore, it is rare to find people who combine excellent skills in all the constituent areas of business analytics. Though there is no application programmer interphase (API) to request the number of available positions from Indeed, a quick search on their website showed that there are 27,908 open positions in the United States related to Business Analytics. It is important to emphasize that other hiring platforms may have other related Business Analytics Positions not included in this search.
References:
Berman, R., & Israeli, A. (2022). The value of descriptive analytics: Evidence from online retailers. Marketing Science, 41(6), 1074–1096.
Bennett-Kapusniak, R. (2015). Baby boomers and technology: Factors and challenges in utilizing mobile devices (Doctoral dissertation, The University of Wisconsin-Milwaukee).
Calvo-Porral, C., & Pesqueira-Sanchez, R. (2020). Generational differences in technology behavior: comparing millennials and Generation X. Kybernetes, 49(11), 2755-2772
Delen, D., & Ram, S. (2018). Research challenges and opportunities in business analytics. Journal of Business Analytics, 1(1), 2-12.
Davenport, T. H., Barth, P., & Bean, R. (2012). How big data is different.
Evans, J. R., & Lindner, C. H. (2012). Business analytics: the next frontier for decision sciences. Decision Line, 43(2), 4-6.
Fienberg, S. E. (1992). A brief history of statistics in three and one-half chapters: A review essay.
Lepenioti, K., Bousdekis, A., Apostolou, D., & Mentzas, G. (2019). Prescriptive analytics: a survey of approaches and methods. In Business Information Systems Workshops: BIS 2018 International Workshops, Berlin, Germany, July 18–20, 2018, Revised Papers 21 (pp. 449-460). Springer International Publishing.
Mishra, N., & Silakari, S. (2012). Predictive analytics: a survey, trends, applications, opportunities & challenges. International Journal of Computer Science and Information Technologies, 3(3), 4434-4438.
Sadiku, M., Shadare, A. E., Musa, S. M., Akujuobi, C. M., & Perry, R. (2016). Data visualization. International Journal of Engineering Research And Advanced Technology (IJERAT), 2(12), 11-16.
Power, D. J., Heavin, C., McDermott, J., & Daly, M. (2018). Defining business analytics: An empirical approach. Journal of Business Analytics, 1(1), 40-53.
Sagiroglu, S., & Sinanc, D. (2013, May). Big data: A review. In 2013 international conference on collaboration technologies and systems (CTS) (pp. 42-47). IEEE.
Sharda, R., Asamoah, D. A., & Ponna, N. (2013). Research and pedagogy in business analytics: Opportunities and illustrative examples. Journal of computing and information technology, 21(3), 171-183.
Shmueli, G., Bruce, P. C., Gedeck, P., & Patel, N. R. (2020). Data mining for Business Analytics: Concepts, techniques, and applications in Python. Wiley.
Webb, S. (2002). Evidence-based practice and decision analysis in social work: An implementation model. Journal of Social Work, 2(1), 45–63.
Wild, C. J., Utts, J. M., & Horton, N. J. (2018). What are statistics? International Handbook of Research in Statistics Education, pp. 5–36.